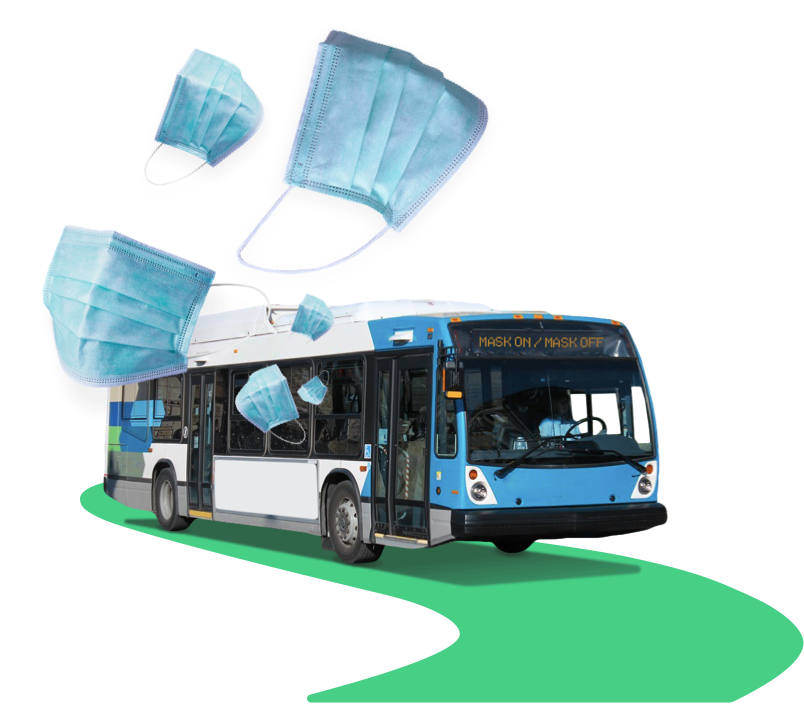
Are masks disappearing from public transit?
A real-time look at mask usage in the United States and Canada as mask mandates expire
A real-time look at mask usage in the United States and Canada as mask mandates expire
Last updated:
Percent of trips where ‘most’ riders are wearing masks
Difference
from yesterday
We’re here to dispel that uncertainty: we’ve created a dashboard that lets you see how mask adoption is changing on public transit, day-by-day, agency-by-agency.
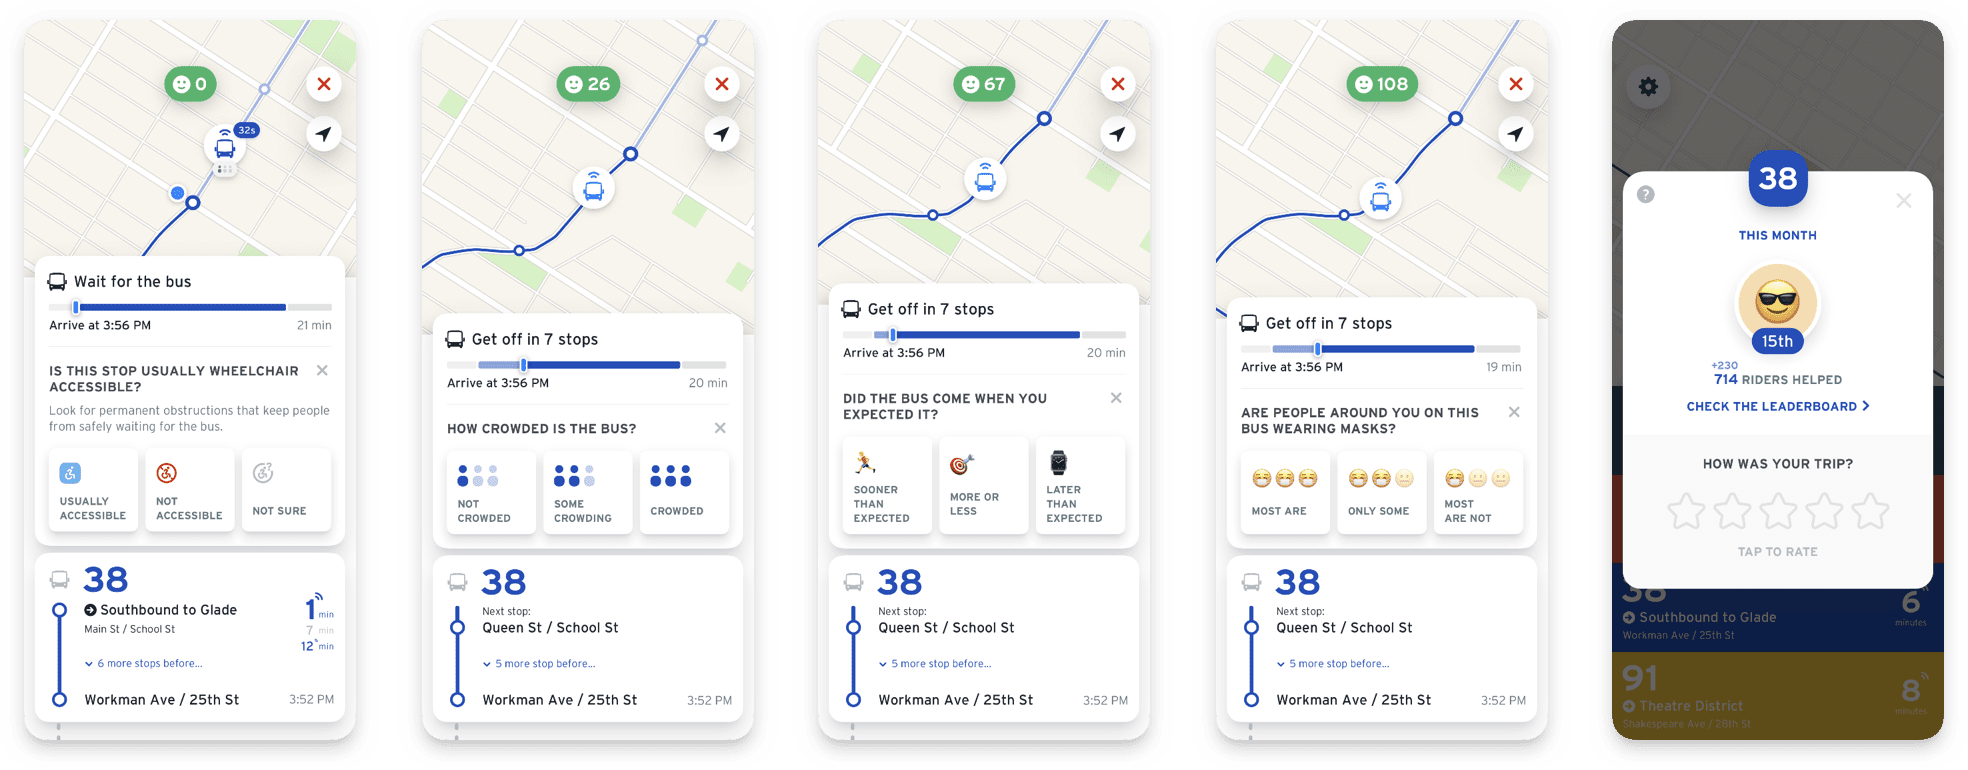
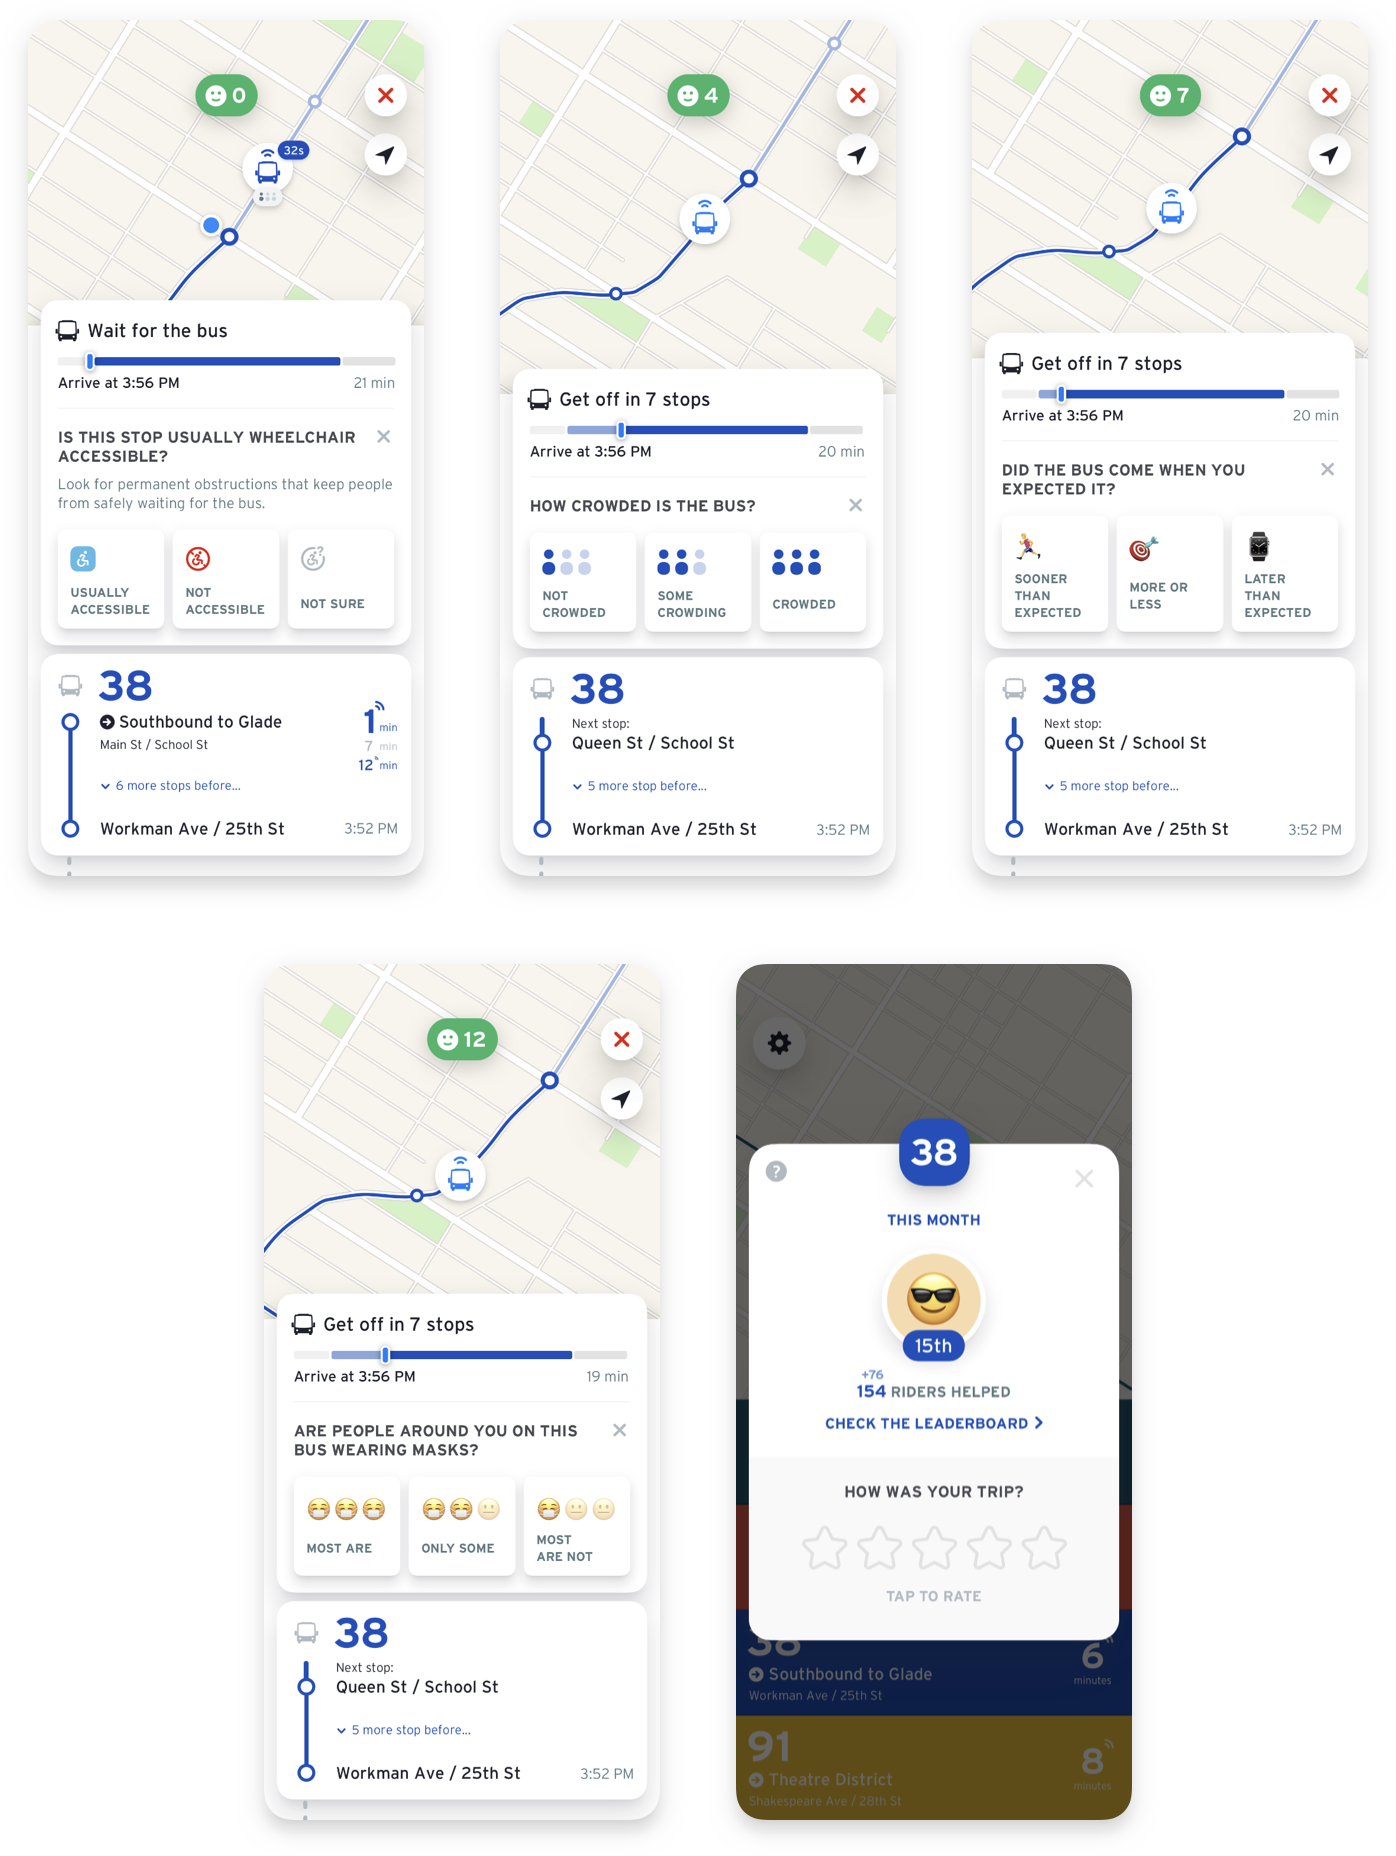
Every day, thanks to tens of thousands of Transit riders, we’re able to gather detailed information about transit service. Did the bus show up on time? Was the train crowded? How many people onboard are wearing masks? It’s all a part of Rate-My-Ride, a new Transit feature that lets riders tell transit agencies (and each other) about the quality of their trip.
In light of the end of mask mandates, we want to make some of this data public. We hope we can give individual agencies a better idea of rider behaviour, and help our riders make informed choices when taking public transit.
Rules around masking on public transit are undergoing rapid changes. You can use this chart to compare changes in different places.
 Daily trips where ‘most’ riders are wearing masks
Masks have largely disappeared from many public transit systems. What will be the downstream effects? Will riders continue returning to public transit at the same pace as they have been since 2021? Or will it slow down their return? Will a decrease in mask usage worsen the operator shortage that’s affecting many transit agencies — or will it have no effect?
Mask wearing is more prevalent at certain times of day. You can use this chart to compare changes over time for each hour of the day.
Hours where ‘most’ riders are wearing masksThe demographics of Transit app users match those of public transit riders overall — as judged by other common survey methods and available US Census data.
We collect information from riders with small unobtrusive surveys in the app. When riders use GO, our step-by-step navigation feature, we prompt them with questions like “is the stop accessible?”, “are most people masked?”, and “how was your ride?” We ask them these questions at precise points along their journey while they’re waiting, riding, and just after they’ve arrived at their destination. We aggregate these “Rate-My-Ride” responses and share them with transit agencies to identify areas for service improvement.
With specific regards to masking: Transit riders are surveyed once per trip, and asked if “most”, “some”, or “few” people are wearing masks. This real-time dashboard shows the % of trips where a majority of riders answer “most”. About 58% of riders who use GO respond to this question.
Please note: we only show agencies where we have a sufficient number of samples. For smaller agencies, we show results along with an error margin (+/- 10% at a 95% confidence level). For the largest agencies, this error margin is narrower (+/- 2% at 95% confidence level).
