We asked users to rate their rides. They ratted out their furry friends. 
Data playground
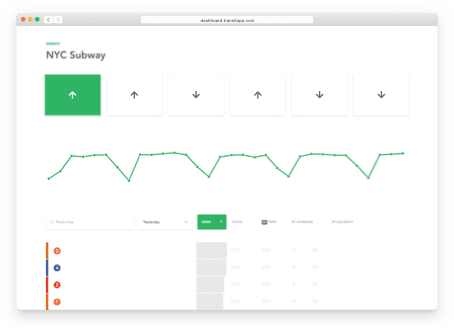
Sharing is a two-way street. We use data provided by agencies, so it’s only right that we share data back about how the app is helping riders.
Sharing is a two-way street. We use data provided by agencies, so it’s only right that we share data back about how the app is helping riders.
We structure our data so that it can never be used to identify individuals. Location coordinates are generalized, and app usage information is stored separate from personal data.

All agencies can access data exports for free, and partners get real-time intel with custom dashboards.
Want it for your agency? Get in touch.


These days smartphones are used by rich, white, tech-savvy pretty much all age and income groups. Our users are representative of public transit riders overall, with strong representation of low-income and non-white people.
Reach out to ask for your city's app demographics
Contact us
Sign up for our quarterly rider report card to benchmark against peer systems. Plus: academics, planning firms, and public agencies can get their own surveys into the right hands, reaching app users by language, neighbourhood, or transit line.
Get in touch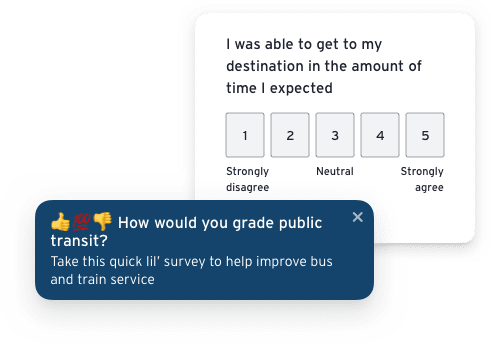


Riders rely on accurate departure countdowns. When your agency’s feed goes down or predictions go bad? You need to know. Our early warning system and accuracy analyzer are here to help.
Sign up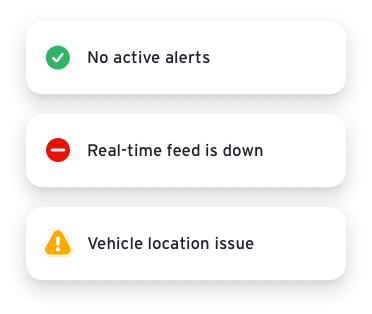
Our public transit and new mobility APIs power the smartest app out there. Now you can bring the magic of our multimodal algorithm to your website or smart kiosk.
Learn more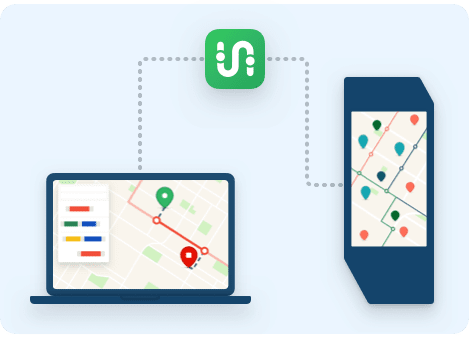
Quarterly ridership reports quickly go stale. So we launched weekly ridership estimates with the American Public Transportation Association to help agencies benchmark against their peers.
Take a look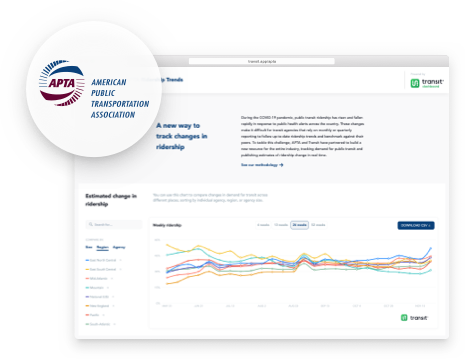
A partner you can trust to deliver the best experience for your riders.
Let’s talk